Seeing is believing. Hence, another big effort of Oracle was to make the data visible which will make it more understandable and useful. This latest addition to Oracle’s analytics offerings in the cloud makes rich, powerful visual analytics accessible to every business user.

Oracle Data Visualization Cloud Service eliminates the complexity typically associated with blending and correlating data sets. Easy, automatic data blending allows users to combine data from a variety of sources—Oracle and other SaaS applications, on-premises systems, external sources and personal files—and immediately gain new insights using visual analysis.

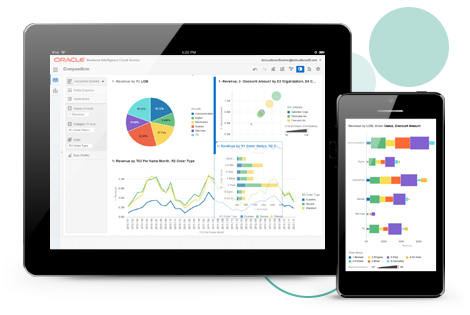
They can enrich the analysis with narratives to create stories that can be shared across the organization in a scalable, secure fashion. The creation and sharing of analytic insights is supported on mobile, tablet and desktop devices, enabling complete flexibility and unlimited access.Oracle Data Visualization Cloud Service is further differentiated by its compatibility and integration with the full breadth of Oracle’s analytics offerings

Striking features of DVCS which will make your decision to take DVCS more strong are as follows:

  • Stunning, smart visualizations: Data Visualization Cloud Service displays the best visualizations for your data automatically—all you have to do is drag and drop. As you add new attributes and filters, the visualizations change to best reflect new data and bring clarity to your investigation. You can also change visualizations at any time, simply by clicking.

  • Automatic highlighting: Related data is automatically connected, so selecting data in one visual highlights correlated data in every other visual, immediately showing patterns and revealing new insights.

  • Guidance and search: Sometimes you know the data you’re working with, and sometimes you don’t. Powerful search, guided navigation, and sophisticated filtering work together intelligently to provide an easy, interactive path through your data, helping you find exactly what you’re looking for.

  • Everything connected: A unified user experience blurs the lines between dynamic discovery, dashboarding, and presentation, creating a seamless and richly contextual environment that keeps your exploration fast and fluid.

  • Visual storytelling and sharing: It’s easy to capture insights as visual stories, saving story points and adding comments to highlight key points and discoveries. Stories are live and can be securely shared with anyone with permission; co-workers can click a link and be brought into the story, build upon it, and share it in turn.

In short, just upload your data files, select the elements you are interested in, and let Oracle Data Visualization Cloud Service find the best way to visualize it. Of course, you can also choose from a wide range of visualizations yourself if you want to look at your data in a specific way.

Let us ponder on the reason why you can Reliason and its key Benefits:

  • Reliason will help you bring the story in your data to life with interactive visualization

  • At Reliason you will get more answers quickly with fast, fluid exploration of all your data and will also make analyzing data and sharing insights easy and engaging

  • Reliason also will help you to securely share business insights with visually stunning graphics and discover the answers to your most pressing business questions—without having to wait for your IT team.

  • Reliason’s reliable team will make sure that you easily blend and visually analyze both personal and enterprise data capturing insights and comments to create an interactive story that can be shared across your organization.

  • We take special care to improve productivity with easy-to-use adaptive design layouts for phones and tablets.

Request a Quote
or call us at +44 (0) 203 778 0091 ( Reliason )
  • Cloud Planning Solution Today

    CONTACT US
  • Oracle Test Drive

    TRY IT FOR FREE